| Home | People | Research | Publications | Demos |
| News | Jobs |
Prospective
Students |
About | Internal |

|
These are demos of the crowd counting system. The video is available in Quicktime format (H.264).
Crowd Counting Demo
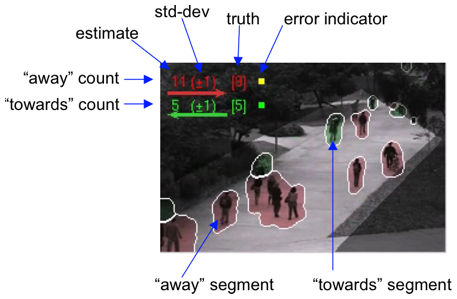
An example video frame is shown below.
The error indicator summarizes the performance of the
system with respect to the ground-truth. The different colors indicate the following: (green dot) the estimate is within one standard-deviation of the groundtruth; (yellow dot) the estimate is within two standard-deviations; (red dot) the estimate is outside 2 standard-deviations. Finally, the frames marked as "training set" were used to train the GP regression model, and
the region-of-interest is also highlighted. The video is
sped up to twice the normal frame rate.

[mov (9.4 MB)]
Crowd Count Plot
These are plots of the crowd count over time. The gray regions are the two-standard-deviations error bars of the Gaussian process regression (i.e. the confidence of the crowd estimate). Click the image to see a larger version.
Note that this segmentation required no reinitialization at any point, or any other type of manual supervision. The sequences contain a fair variability of traffic density, various outlying events (e.g. bicyclies, skateboarders, or small vehicles, pedestrians changing direction, etc.) and variable environmental conditions (e.g. varying clouds and shadows).
Training Set Video
Test Set Video
Crowd Count Plot
This is a plot of the crowd count for all the video. The bars indicate when the system has low confidence in the count estimates (i.e. when the standard-deviation of the Gaussian process is over 3). Click the image for a larger version.
|
![]()
©
SVCL